What does Fig.add_subplot(111) mean in Matplotlib?
Asked 2 years ago, Updated 2 years ago, 205 viewsWhen you run this code
import matplotlib.pyplot as plt
x = [1, 2, 3, 4, 5]
y = [1, 4, 9, 16, 25]
fig = plt.figure()
fig.add_subplot(111)
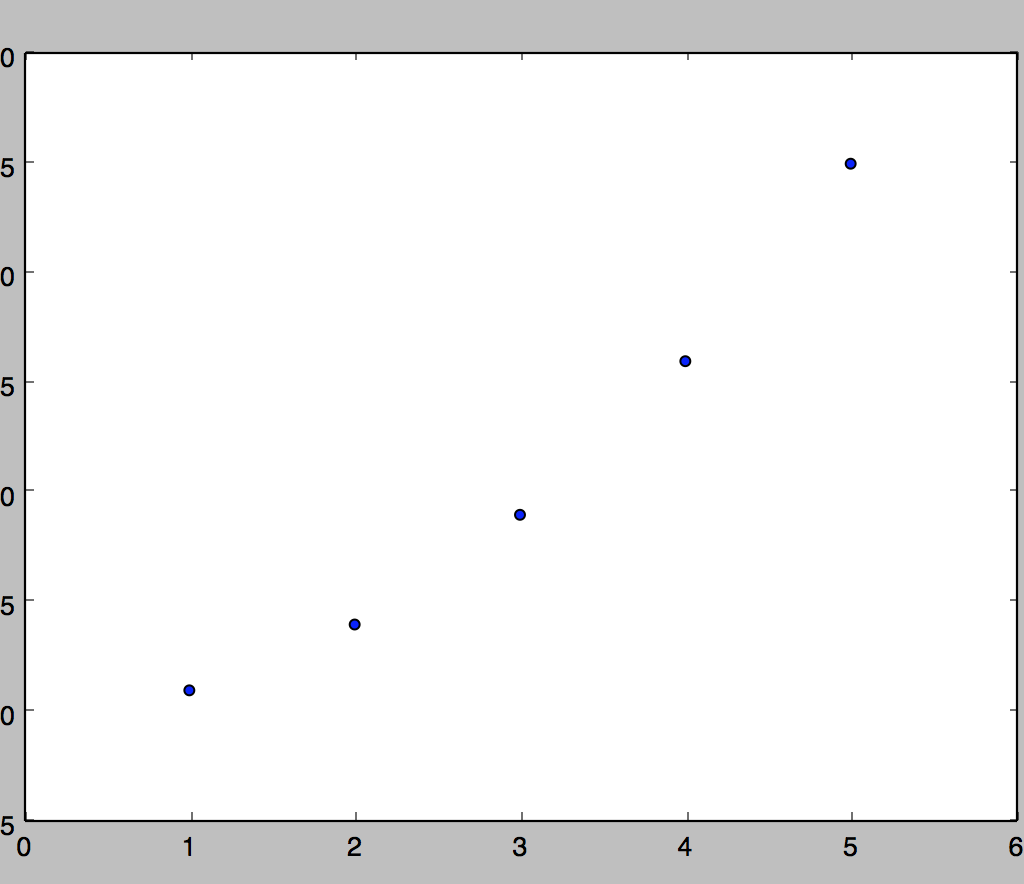
plt.scatter(x, y)
plt.show()
Output:
I'm just learning, so I'm following them one by one, but I don't know what 111 is doing ㅜㅜ Sometimes, 212 or something like that comes out. What does that figure.add_subplot() mean?
python mathplotlib figure
2022-09-22 22:16
1 Answers
111 is a representation of the subplot grid factor in one integer.
That is, config.add_subplot(111) == config.add_subplot(1,1,1)
You could say that.
For example,
Source: add_subplot (*args, **kwargs)
2022-09-22 22:16
If you have any answers or tips
Popular Tags
python x 4647
android x 1593
java x 1494
javascript x 1427
c x 927
c++ x 878
ruby-on-rails x 696
php x 692
python3 x 685
html x 656
© 2025 OneMinuteCode. All rights reserved.