plot an exponential function with f = 10^n in matplotlib as y = x graph
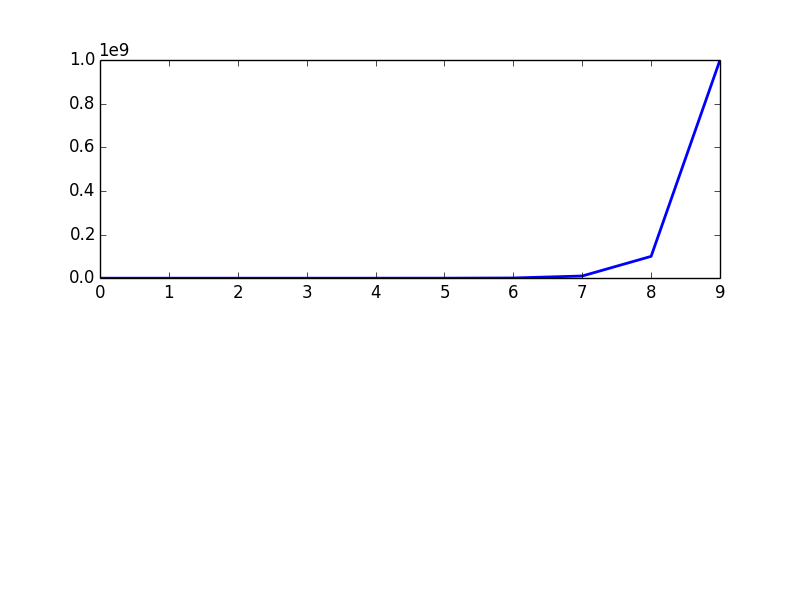
Asked 2 years ago, Updated 2 years ago, 138 viewsThe function f(x) = 10x is an exponential function, so if you just draw it, it looks like a curve, but you want to draw it in a straight line as if you logged it.
xI've tried, but this is the limit I can make.It's too hard
Is there a shorter and simpler way to do it like 'scale=linear'?
from pylab import *
import matplotlib.pyplot  as pyplot
a = [ pow(10,i) for i in range(10) ]
fig = pyplot.figure()
ax = fig.add_subplot(2,1,1)

line, = ax.plot(a, color='blue', lw=2)
show()
2022-09-22 22:14
1 Answers
First of all, I'd like to say that I don't recommend using both Pilab and Pyplot. If you want to use a pilot, use a pilot
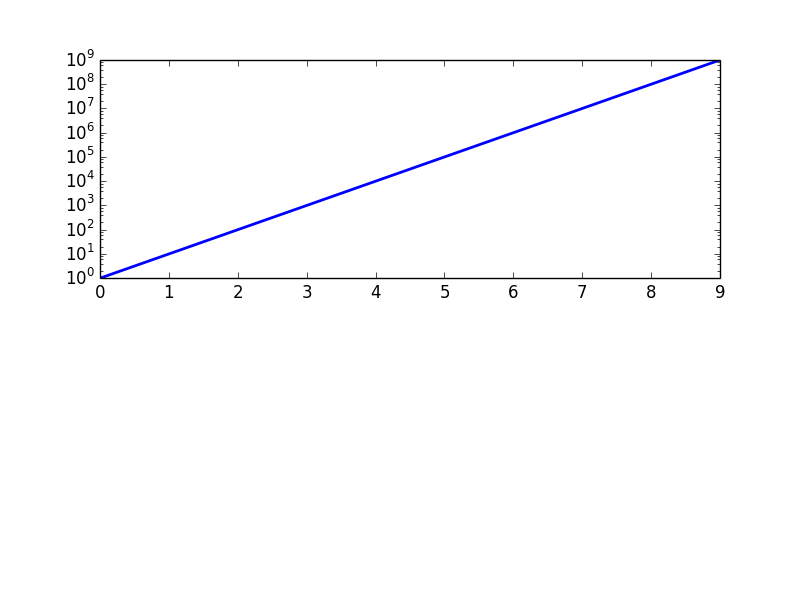
So, to get to the point, you want to decide on the y-axis.
Then matplotlib.Use pyplot.yscale (*args, **kwargs).
A function used to determine the scale on the y-axis.
Simply put, the factor scale is
You can choose from among them.
from matplotlib import pyplot

a = [power(10,i) for i in range(10)] #same

pyplot.subplot(2,1,1) #same
pyplot.plot(a, color='blue', lw=2)
pyplot.yscale('log')
pyplot.show()
2022-09-22 22:14
If you have any answers or tips
Popular Tags
python x 4647
android x 1593
java x 1494
javascript x 1427
c x 927
c++ x 878
ruby-on-rails x 696
php x 692
python3 x 685
html x 656
© 2025 OneMinuteCode. All rights reserved.